
2021 marked a turning point for the video streaming industry statistics, as the growth wasn’t just strong but seismic. Live streaming stats from 2021 to 2022 show that this medium rewrote how people consume video.
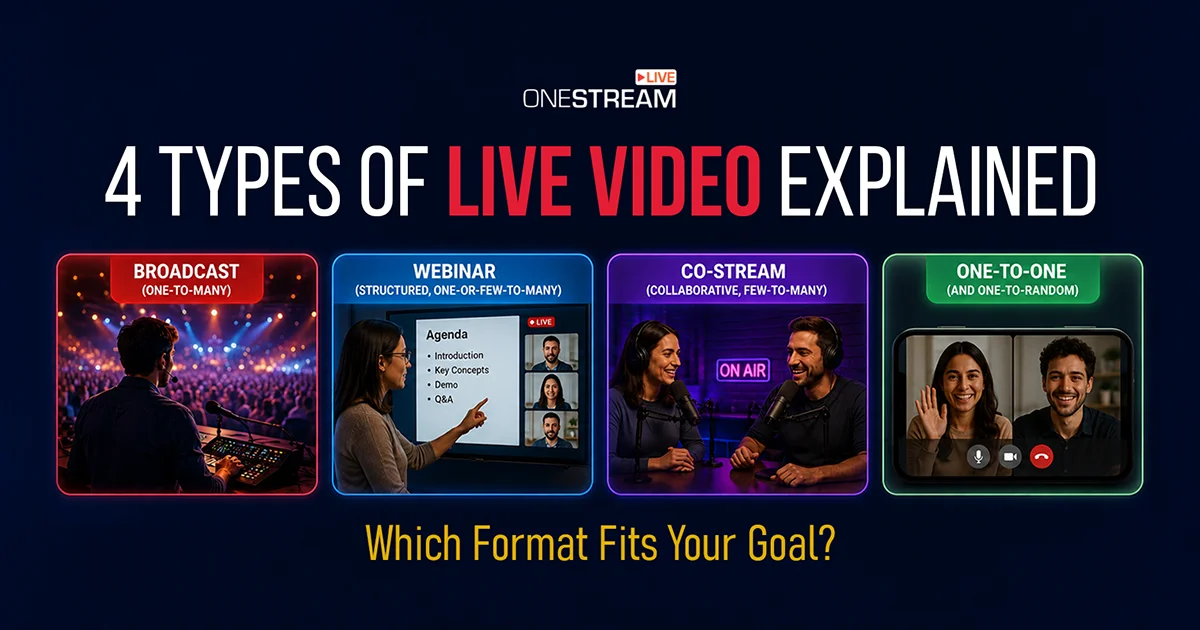
As in-person events still hiccuped, more people turned to live streams across work, worship, and entertainment. Most viewed live stream formats built communities and shook up what creators expect from their audiences.
Streaming took over more of our attention, streaming statistics showed rising investment in platforms, and live streaming trend data hinted at which formats would dominate. According to Statista data, the video streaming market revenue globally in 2021 was roughly US$73.86 billion, with an annual growth rate of around 24.3% compared to the previous year.
- Streaming statistics from 2021 show explosive market growth across industries.
- Most viewed live stream categories included sports, gaming, education, and worship.
- Video streaming industry statistics confirm that live formats kept audiences watching longer than on-demand content.
- Live streaming platforms like Twitch, YouTube, and Facebook led in hours watched and global reach.
- Businesses embraced video streaming insights to run meetings, product launches, and trade show promotions.
- The live streaming trend extended to fitness, healthcare, and worship, not just entertainment.
- Post-COVID, the live streaming market matured into a long-term consumer habit.
Growth of Live Streaming in 2021
Looking at streaming statistics from 2021, the growth curve was explosive.
- Live streaming viewing time grew 93% year over year in Q2 2019, and average live session length was 26.4 minutes, per Conviva’s Q2 2019 data as reported by StreamingMedia.
- A commonly cited primary forecast estimates the global live streaming market will reach USD 345.13 billion by 2030 (CAGR 23.0%, 2024–2030), per Grand View Research.
- Live videos capture viewers’ attention 1-20 times longer than pre-recorded on-demand videos (Forrester Research, 2017).
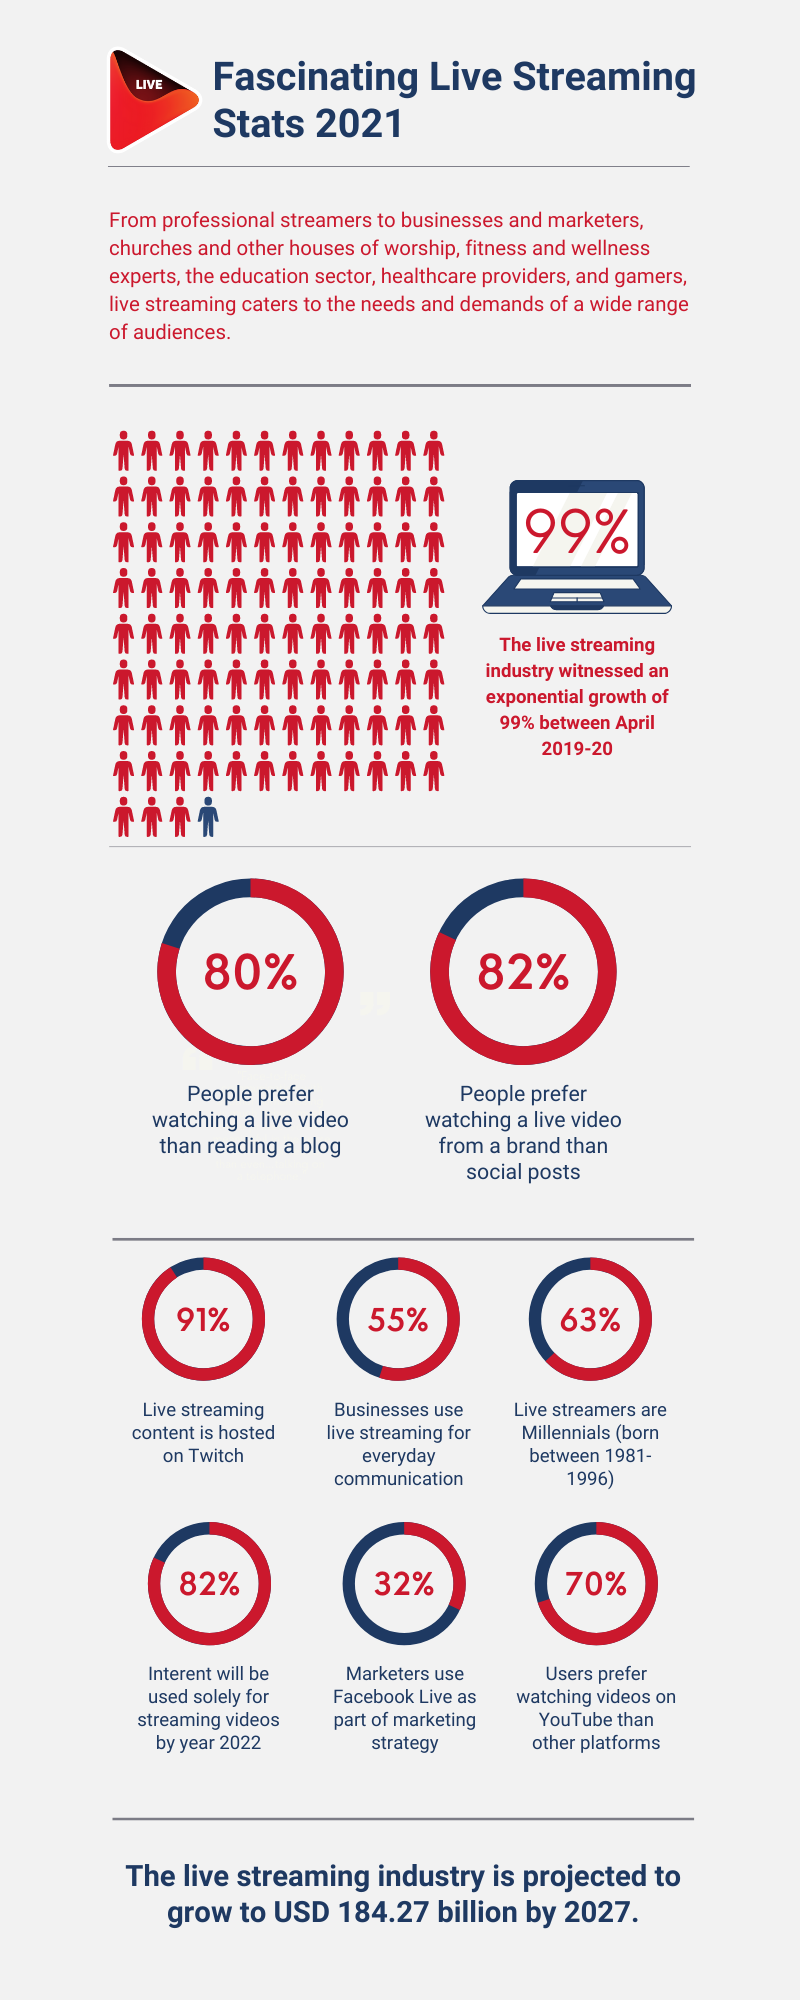
- Livestreaming hours watched increased 99% year over year from April 2019 to April 2020, per StreamElements/Arsenal.gg analyses reported in industry coverage during the early pandemic period.
- Conviva’s Q4 2019 “State of Streaming” shows overall time spent streaming up 58% in 2019 globally, providing broader context to the strong 2019 growth pattern alongside the Q2 live-session metrics.
- Cisco’s Visual Networking Index forecast projected that internet video would account for 82% of all consumer internet traffic by 2022.
By 2021, multistreaming across platforms became standard practice, and features like interactive chat and captions were imperative. OneStream Live users, for instance, could stream to over 45 destinations at once, turning growth trends into audience reach in a single step.

Audience for Live Streams in 2021
Who was watching live streams in 2021? The numbers show clear patterns across demographics and regions.
- Millennials led the pack: Around 63% of regular live stream viewers were aged 18–34, making them the dominant group. (Neil Patel)
- Gen Z gained ground: Gen Z showed strong adoption, especially on social-first live streaming platforms like Instagram Live and TikTok Live. (GWI Flagship Report 2020)
- Mobile-first audiences: More than 90% of people watched live videos over the internet, with mobile devices being the preferred screen. (PwC)
- Global adoption: By mid-2021, China alone accounted for over 600 million live stream viewers, showing how the live streaming trend was driven by emerging markets as well. (Statista)
- Communities beyond gaming: While Twitch dominated gaming, worship services, online education, and wellness became key drivers of viewership, highlighting how diverse the video stream trends had become.
Preferred Media for Watching Live Streams in 2021
How did people actually watch their favorite streams in 2021? The live streaming stats shows a strong tilt toward mobile, but desktop and multi-platform viewing still had a place.
- Social live usage split: Facebook 26%, Snapchat 15%, Instagram 13%, and Twitter/Periscope 13% engaged with live streams in the past month, from GWI’s Social Video report based on Q4 2018 fieldwork published in 2019.(GWI)
- Mobile-first consumption: On average, people spent 16 minutes per day watching video on mobile compared to just 7 minutes on desktop. (Statista)
- Social media’s role: About 26% of viewers streamed via Facebook, 15% on Snapchat, 13% on Instagram, and 13% on Twitter. (GWI Social Video Report 2019)
- YouTube remained dominant: Around 70% of users preferred watching live content on YouTube over other networks. (Livestream)
- Twitch’s global lead: Twitch amassed roughly 24.0–24.3 billion hours watched in 2021, far above 9.3 billion. (Streams Charts)
Live Streaming Stats for Business in 2021
The pandemic accelerated digital adoption, but 2021 proved that businesses were committed to it. Here’s what the video streaming industry statistics revealed:
- More traffic through video: Businesses using video, including live formats, enjoyed 41% more traffic from searches. (TechJury)
- Regular use in organizations: Industry summaries report that a majority of enterprises used live streaming for internal communications and marketing use cases by 2021–2022. (Haivision)
- Most effective for events: A quarter of marketers said live video was their most effective tool for promoting trade shows and events. (The Social Effect)
- Budget priorities shifting: US video ad spending was forecast to reach about $103B by 2023, according to Forrester’s Video Advertising Forecast, with live formats making up a growing share. (Forrester)
- Enterprise adoption: In 2021, enterprises widely adopted live video for corporate communications and events by the early 2020s, with research indicating strong usage across town halls, product launches, and stakeholder updates. (The Switch)
Live Streaming Trends in Marketing (2021)
If 2020 was the year marketers tested live video, 2021 was the year it became a staple. The live streaming trend reshaped brand communication, with audiences clearly preferring real-time content over static posts.
- Higher preference for live content: Around 82% of viewers said they preferred a live stream from a brand to standard social posts. (TechJury)
- Blogs vs streams: Nearly 80% of people preferred live video over reading blog articles. (TechJury)
- Discovery channel: Roughly 1 in 5 users discovered new products and brands through social media live streams. (GWI Social Media Trends Report 2020)
- Facebook Live dominance: About 32% of marketers planned to use Facebook Live as a core part of their video strategy going forward. (Influencer Marketing Hub)
- Investment priorities: Facebook ranked as the #1 network for live marketing investment, followed closely by YouTube and Instagram. (Animoto)
Social Media Live Streaming Stats
Social networks became the heartbeat of live video in 2021, driving most of the video stream trends that shaped creator strategies.
- Higher share power: Videos on social media generated 1,200% more shares than images and text combined, showing just how dominant live formats had become. (TechJury)
- LinkedIn Live growth: Usage of LinkedIn Live increased by 158% from Q1 to Q3 2020, and the upward trend continued into 2021 as businesses leaned on professional live events. (LinkedIn)
- Twitch dominance: By 2021, Twitch logged over 9.3 billion watch hours, hosting 91% of all live streaming content globally. (TechJury)
- YouTube Live preference: Roughly 70% of users preferred YouTube for live video compared to other platforms. (Livestream)
- Facebook Live share: About 1 in 5 Facebook videos was live, making it one of the top live streaming platforms for creators and brands. (Facebook)
Impact of COVID-19 on Live Streaming
The pandemic literally rewired the live streaming industry. By 2021, the data showed that live video had shifted from a temporary workaround to a permanent habit.
- Event explosion: The number of live-streamed events jumped by 1,468% between January and August 2020, with momentum carrying into 2021. (Uscreen)
- Search demand: Search engines recorded a 300–500% spike in queries for live streaming platforms in March 2020, and interest stayed elevated well into 2021. (Google Trends)
- Higher watch time: Global live stream watch time increased by 250% during COVID, proving audiences had made streaming a daily routine. (Think with Google)
- Business adoption: By 2021, 70% of business streamers were streaming daily or weekly to maintain customer and employee engagement. (ReStream)
- Fitness boom: In the first six months of lockdown, the fitness sector saw an increase of over 1,300% in minutes of live streaming, a trend that continued through 2021. (Uscreen)
- Remote education: Between spring and fall semesters of 2020, live-streamed education grew by 980%, setting the stage for hybrid classrooms in 2021. (Uscreen)
- Worship services: In the U.S., more than 11,000 houses of worship adopted live streaming once COVID hit, serving over 4.7 million worshipers online. (Washington Post)
Conclusion
The numbers leave little doubt: live streaming stats from 2021 marked a watershed moment for the industry. Audiences tuned in longer, discovered new products through live events, and made streaming part of their daily routines. For creators and businesses, the lesson was clear: live video had become the expectation.
Open captions, closed captioning, multistreaming, and interactivity all rose in importance as creators tried to meet audiences where they were: on mobile, across multiple platforms, and in real time. From most viewed live stream formats like sports and concerts to classrooms and houses of worship, the live streaming industry broadened dramatically.
With OneStream Live, creators were able to adapt quickly by scheduling pre-recorded sessions, multistreaming across more than 45 destinations, and accessing analytics to understand shifting video streaming insights. As the live streaming market continued to expand into 2022 and beyond, the creators and organizations that embraced this momentum set themselves up not just to keep pace but to lead.

Frequently Asked Questions
Streaming accounts for over 80% of global internet traffic, underscoring its significant growth and influence in the entertainment and content consumption sectors.
Gaming content, including esports and personal gameplay, remains the most popular and widely viewed genre of live streaming.
The most-viewed live stream is held by The Final Countdown for the Twitch streamer “Ninja” in 2018, with over 635,000 concurrent viewers.
YouTube Live is considered the number one live streaming platform, boasting the most significant number of active users and a diverse range of content types.
The live streaming industry experienced a 99% growth in 2021, with global live streaming revenue surpassing $70 billion.
In 2021, approximately 82% of internet users worldwide watched live streaming content, demonstrating the format’s immense popularity.
The pandemic triggered massive adoption across fitness, education, and religious services, with event streaming increasing by over 1,400%.
OneStream Live is a cloud-based live streaming solution to create, schedule, and multistream professional-looking live streams across 45+ social media platforms and the web simultaneously. For content-related queries and feedback, write to us at [email protected]. You’re also welcome to Write for Us!